Economic Revitalization
Tracking downtown revitalization
Since the onset of COVID-19, DSA has been tracking the impact on our local economy. As downtown bounces back, we continue to follow dozens of metrics to trace the path to full economic recovery. A few of these metrics are below.
Downtown Revitalization Dashboard
April 2025 (March data)
Downtown Seattle was the first American urban center to experience the impacts of COVID-19, enduring a sudden economic downturn. As downtown continues to evolve, DSA will publish a monthly Revitalization Dashboard examining key metrics. The data sets provide a comparison point to the same time period in 2019. Additionally, the dashboard will feature notable stories that provide context regarding downtown’s renewal and reemergence.
Please credit the Downtown Seattle Association Revitalization Dashboard for use of charts, data and images on this page.
Total monthly visitors since 2019
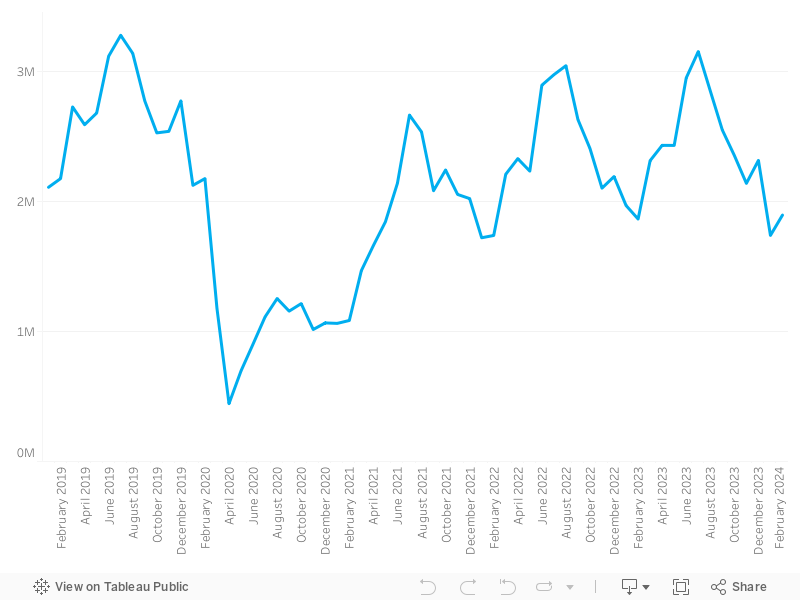
More than 2.5 million unique visitors came downtown in March 2025. This represents 92% of the visitors seen in March 2019. This is a year-over-year increase of 5% and 30% more unique visitors than in February 2025.
Average weekday worker foot traffic
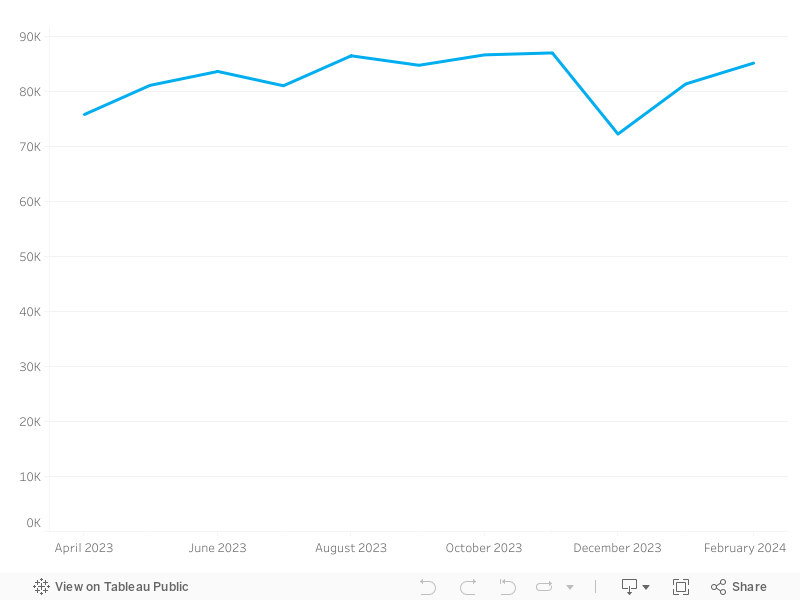
In March, downtown averaged nearly 101,000 daily workers — the highest daily average since March 2020. This figure represents 60% of March 2019’s average daily worker foot traffic, and is a 12% increase from March 2024.
Monthly hotel rooms sold compared to 2019
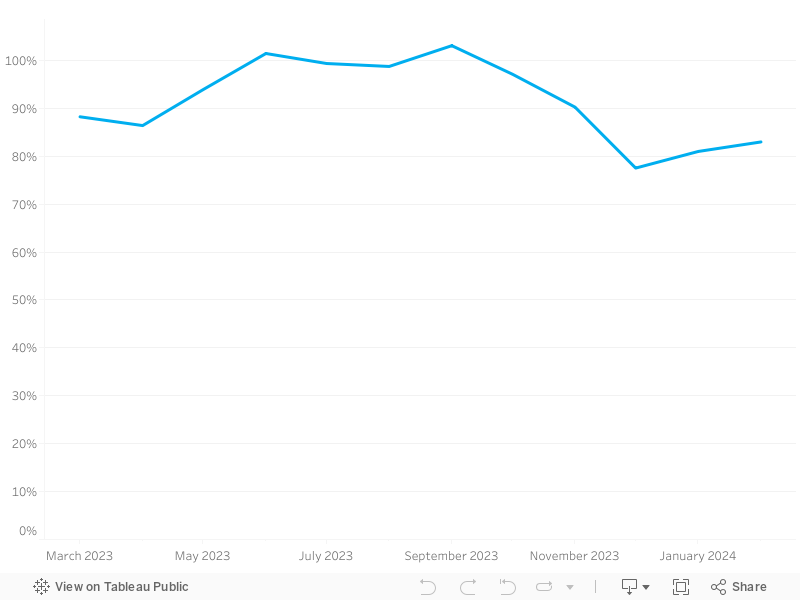
There were nearly 326,000 downtown hotel rooms sold in March 2025. This figure represents 93% of the demand in March 2019, and a four-point decrease in demand compared to March 2024.
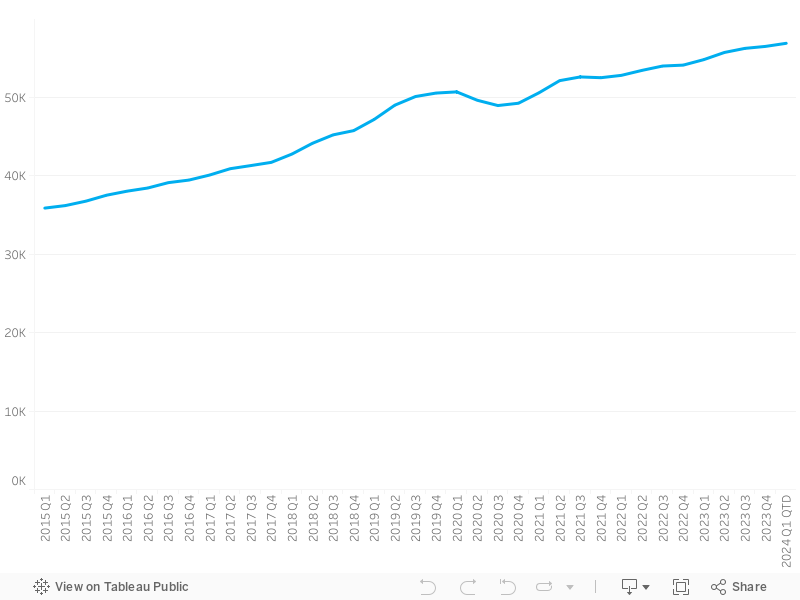
In March, the number of occupied apartment units downtown continued growing, rising to more than 59,000. This represents a 4% increase compared to Q1 2024 and a 26% increase compared to Q1 2019.
Of Note in Downtown
![]()
Local visitors (people who live within 10 miles of downtown) are coming to the center city at an increasing rate. March 2025 saw 104% of local visitors compared to March 2019.
![]()
In the third month of Amazon’s return to five days a week in the office, the South Lake Union and Denny Regrade neighborhoods saw daily worker foot traffic of nearly 48,000 — 76% of March 2019 numbers.
![]()
Seattle’s 2025 cruise season has set sail. The Port of Seattle expects nearly 300 ship visits and 1.9 million revenue passengers this year. The industry generates an estimated $900 million annually in local economic impact.
Coming Up in Downtown

The 20th Asia-Northwest Cultural Education Association’s Sakura Con is expected to bring 35,000 people to the Seattle Convention Center’s Arch and Summit buildings April 18–20. Visit Seattle estimates the anime convention will generate $19.4 million in economic impact.

The Tony Award-winning musical “Parade” is coming to The 5th Avenue Theatre April 16–May 4. Hailed as a Critic’s Pick by The New York Times, “Parade” recalls an era of big casts, big stories and big talents.

The Occidental Square Trading Post returns April 26. This quarterly market in the heart of historic Pioneer Square features more than 30 local vendors selling handmade, antique and vintage goods alongside live music and performances.
COVID-19 Downtown Recovery Weekly Snapshot
These charts show weekly statistics from March 2020 through the most recent week available. To indicate the level of recovery, data is displayed as a percent of the same metric for the comparable week of 2019.
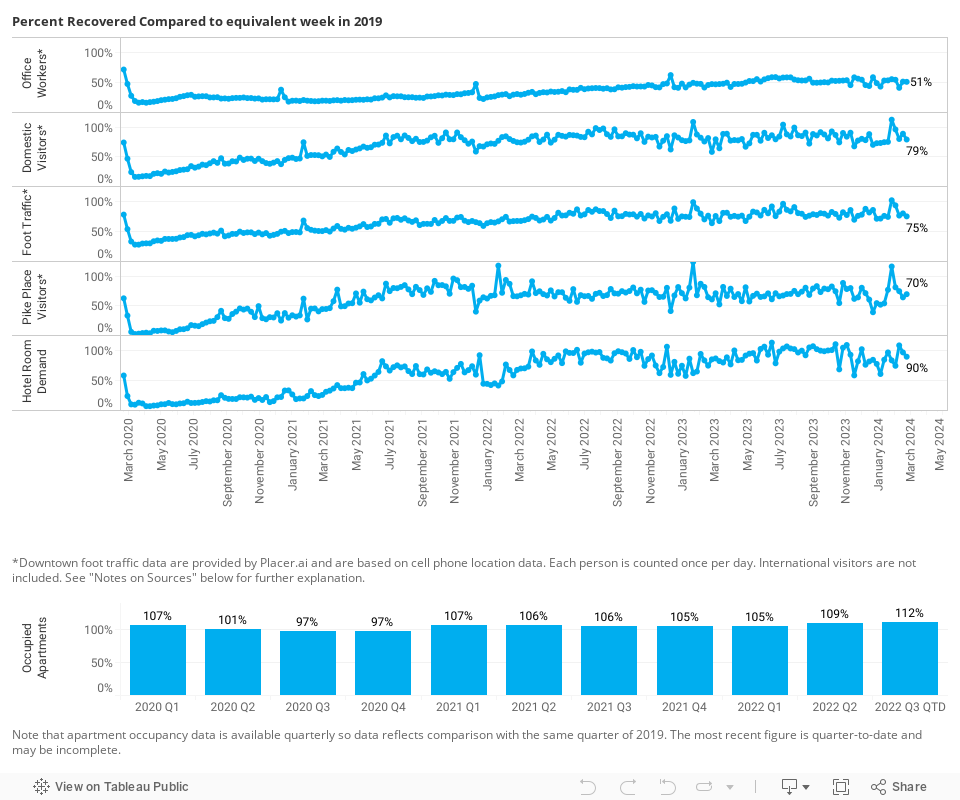
Notes on Sources
Downtown foot traffic data are provided by Placer.ai and are based on cell phone location data. Each person is counted once per day. International visitors are not included. Subsets of this data in the charts are as follows:
- Office worker presence is estimated based on visits by workers who were present between 8 a.m. and 6 p.m. on weekdays in the downtown neighborhoods with the heaviest concentration of office space.*
- Total visitors includes those who do not live or work downtown. It does not include international visitors.
- Hotel data are based on monthly reports from STR, provided by Visit Seattle.
- Apartment occupancy data are from CoStar. This is reported quarterly but the current quarter data are updated in real-time as new information is added to the database.
- Domestic visitors counts those who do not live or work downtown.
- Total foot traffic includes all visits to downtown by domestic visitors, residents and workers.
- Pike Place Market visitors includes domestic visitors who do not live or work at the Pike Place Market.
*Note that workers who have not visited their work site in the past 90 days are classified as “visitors” until they are regularly visiting their work site at least three times in a one-week period.